
[vc_row full_width=”stretch_row” css_animation=”fadeIn” el_class=”header-custom”][vc_column][rev_slider_vc alias=”slider-resources”][vc_custom_heading source=”post_title” font_container=”tag:h1|text_align:left” use_theme_fonts=”yes” css_animation=”none” el_class=”title-banner”][vc_raw_html]JTNDYSUyMG5hbWUlM0QlMjJzZWN0aW9uLWdlb3Zpc3VhbGl6YXRpb24td2FsbCUyMiUzRSUzQyUyRmElM0U=[/vc_raw_html][/vc_column][/vc_row][vc_row][vc_column][vc_breadcrumbs initial_loading_animation=”none”][/vc_column][/vc_row][vc_row full_width=”stretch_row” css=”.vc_custom_1510096607600{padding-top: 15px !important;padding-bottom: 50px !important;background-color: #f0f0f0 !important;}”][vc_column][vc_custom_heading text=”GEOVISUALIZATION WALL” font_container=”tag:h1|text_align:left|color:%23500000″ use_theme_fonts=”yes” css_animation=”none”][vc_row_inner][vc_column_inner width=”1/2″][vc_column_text]
Scientific visualization is becoming increasingly important in the Earth sciences as a way to address the large volumes of spatio-temporal data collected by sensor networks and imaging sensors. Large volumes of data must be examined, and data and information integration and synthesis through visualization can aide in scientific inquiry and applied problem solving. GEOSAT’ s visualization wall permits people to use the power of the human visualization system to evaluate large geographic areas and facilitates discovery and decision support. The GEOSAT Visualization Wall is located in the Eller O&M Building Room 807 at Texas A&M University.
[/vc_column_text][vc_btn title=” DOWNLOAD TEMPLATE” style=”outline-custom” outline_custom_color=”#500000″ outline_custom_hover_background=”#500000″ outline_custom_hover_text=”#ffffff” shape=”square” link=”url:https%3A%2F%2Fgeosat.tamu.edu%2Fwp-content%2Fuploads%2F2018%2F09%2FVisualization-Wall_Powerpoint-Template.pptx|title:Request%20form||” css=”.vc_custom_1543593833662{background-color: #ffffff !important;}”][vc_btn title=”RESOURCE REQUEST FORM” style=”outline-custom” outline_custom_color=”#500000″ outline_custom_hover_background=”#500000″ outline_custom_hover_text=”#ffffff” shape=”square” link=”url:https%3A%2F%2Fgeosat.tamu.edu%2Fwp-content%2Fuploads%2F2018%2F11%2FGEOSAT-Visualization-Wall-Request-Form.pdf|title:Request%20form||” css=”.vc_custom_1542752956913{background-color: #ffffff !important;}”][/vc_column_inner][vc_column_inner width=”1/2″][vc_gallery type=”nivo” interval=”3″ images=”2442,2443,2436,2439,2434,2438,2435,2437,2440,2441″ img_size=”full” onclick=”” css_animation=”none”][/vc_column_inner][/vc_row_inner][vc_raw_html]JTNDYSUyMG5hbWUlM0QlMjJzZWN0aW9uLWhvdXN0b24tYnVpbGRpbmclMjIlM0UlM0MlMkZhJTNF[/vc_raw_html][/vc_column][/vc_row][vc_row full_width=”stretch_row” css=”.vc_custom_1510096752720{padding-top: 15px !important;padding-bottom: 50px !important;background-color: #ffffff !important;}”][vc_column width=”1/2″][vc_custom_heading text=”HOUSTON BUILDING
(SECURED FACILITIES)” font_container=”tag:h1|text_align:left|color:%23500000″ use_theme_fonts=”yes” css_animation=”none” css=”.vc_custom_1541098160114{padding-bottom: 10px !important;}”][vc_column_text]
GEOSAT has a dedicated workspace in the Houston Building (Rooms 108A&B) facilitating faculty and student research and contract projects. The Houston Building provides a ~2K square feet space with modern visualization and computational capabilities. This workspace is home to industry projects that require secured facilities and data storage capabilities.
[/vc_column_text][vc_btn title=”REQUEST RESOURCE FORM” style=”outline-custom” outline_custom_color=”#500000″ outline_custom_hover_background=”#500000″ outline_custom_hover_text=”#ffffff” shape=”square” align=”center” link=”url:https%3A%2F%2Fgeosat.tamu.edu%2Fwp-content%2Fuploads%2F2018%2F11%2FGEOSAT-Resource-Request-Form.pdf|title:Request%20form||” css=”.vc_custom_1542753646070{background-color: #ffffff !important;}”][vc_raw_html]JTNDYSUyMG5hbWUlM0QlMjJzZWN0aW9uLWhpZ2gtcGVyZm9ybWFuY2UlMjIlM0UlM0MlMkZhJTNF[/vc_raw_html][/vc_column][vc_column width=”1/2″][vc_column_text][/vc_column_text][/vc_column][/vc_row][vc_row full_width=”stretch_row” css=”.vc_custom_1510598731467{padding-top: 15px !important;padding-bottom: 50px !important;background-color: #ffffff !important;}” el_class=”hide”][vc_column width=”1/4″][vc_single_image image=”1583″ alignment=”center”][vc_custom_heading text=”HOUSTON BUILDING (SECURED FACILITY)” font_container=”tag:h5|text_align:center|color:%23500000″ use_theme_fonts=”yes” css_animation=”none” el_class=”title-section”][vc_raw_html]JTNDYSUyMG5hbWUlM0QlMjJzZWN0aW9uLWdlb3NwYXRpYWwtZGF0YXMlMjIlM0UlM0MlMkZhJTNF[/vc_raw_html][/vc_column][vc_column width=”3/4″][/vc_column][/vc_row][vc_row full_width=”stretch_row” css=”.vc_custom_1510330087129{padding-top: 15px !important;padding-bottom: 50px !important;background-color: #f0f0f0 !important;}”][vc_column][vc_custom_heading text=”HIGH PERFORMANCE
COMPUTING TERRA” font_container=”tag:h1|text_align:left|color:%23500000″ use_theme_fonts=”yes” css_animation=”none” css=”.vc_custom_1542401853627{padding-bottom: 15px !important;}” el_class=”title-section”][vc_row_inner][vc_column_inner width=”1/2″][vc_column_text]
Terra is a 304-node heterogeneous Intel Broadwell cluster from Lenovo with an Omni-Path Architecture (OPA) interconnect and 48 NVIDIA K80 dual-GPU accelerators. TAMU’s High Performance Research Computing Group (HPRC) administers this resource.
[/vc_column_text][vc_btn title=”SYSTEM INFORMATION” style=”outline-custom” outline_custom_color=”#500000″ outline_custom_hover_background=”#500000″ outline_custom_hover_text=”#ffffff” shape=”square” link=”url:https%3A%2F%2Fhprc.tamu.edu%2Fwiki%2FTerra%253AIntro|title:Request%20form||” css=”.vc_custom_1538408472897{background-color: #ffffff !important;}”][vc_btn title=”USER GUIDE” style=”outline-custom” outline_custom_color=”#500000″ outline_custom_hover_background=”#500000″ outline_custom_hover_text=”#ffffff” shape=”square” link=”url:https%3A%2F%2Fhprc.tamu.edu%2Fwiki%2FTerra|title:Request%20form||” css=”.vc_custom_1538408498232{background-color: #ffffff !important;}”][vc_raw_html]JTNDYSUyMG5hbWUlM0QlMjJzZWN0aW9uLXdpbmRvd3MtdmlydHVhbCUyMiUzRSUzQyUyRmElM0U=[/vc_raw_html][/vc_column_inner][vc_column_inner width=”1/2″][vc_column_text]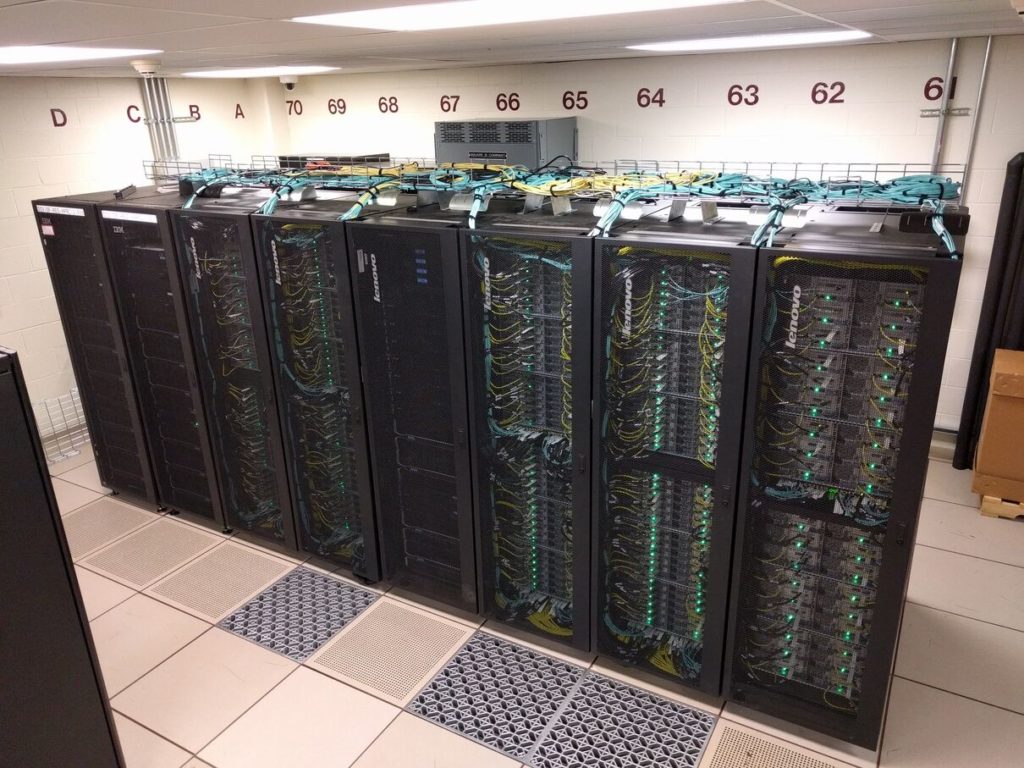 [/vc_column_text][/vc_column_inner][/vc_row_inner][/vc_column][/vc_row][vc_row css=”.vc_custom_1510095460052{padding-top: 15px !important;padding-bottom: 50px !important;}”][vc_column][vc_custom_heading text=”WINDOWS VIRTUAL MACHINE
SOFTWARE” font_container=”tag:h1|text_align:left|color:%23500000″ use_theme_fonts=”yes” css=”.vc_custom_1542401876712{padding-bottom: 10px !important;}”][vc_row_inner][vc_column_inner width=”1/2″][vc_column_text]
VM software available to users includes remote sensing, GIS, statistical and graphics software systems. Software packages include ArcGIS, Imagine, eCognition, GRASS, Matlab, Sigmaplot and other OpenSource software.
[/vc_column_text][vc_btn title=”AVAILABLE SOFTWARE” style=”outline-custom” outline_custom_color=”#500000″ outline_custom_hover_background=”#500000″ outline_custom_hover_text=”#ffffff” shape=”square” link=”url:https%3A%2F%2Fgeosat.tamu.edu%2Fwp-content%2Fuploads%2F2018%2F09%2FVirtual-Machine-Software.pdf|title:Request%20form||” css=”.vc_custom_1537931492064{background-color: #ffffff !important;}”][vc_btn title=”REQUEST RESOURCE FORM” style=”outline-custom” outline_custom_color=”#500000″ outline_custom_hover_background=”#500000″ outline_custom_hover_text=”#ffffff” shape=”square” link=”url:https%3A%2F%2Fgeosat.tamu.edu%2Fwp-content%2Fuploads%2F2018%2F11%2FGEOSAT-Resource-Request-Form.pdf|title:Request%20form||” css=”.vc_custom_1542754333041{background-color: #ffffff !important;}”][vc_raw_html]JTNDYSUyMG5hbWUlM0QlMjJzZWN0aW9uLWhvbG9sZW5zJTIyJTNFJTNDJTJGYSUzRQ==[/vc_raw_html][/vc_column_inner][vc_column_inner width=”1/2″][vc_gallery type=”nivo” interval=”3″ images=”2418,2419,2420,2421,2422,2423″ img_size=”full” onclick=”” css_animation=”fadeIn”][/vc_column_inner][/vc_row_inner][/vc_column][/vc_row][vc_row full_width=”stretch_row” css=”.vc_custom_1510096607600{padding-top: 15px !important;padding-bottom: 50px !important;background-color: #f0f0f0 !important;}”][vc_column][vc_custom_heading text=”HOLOLENS” font_container=”tag:h1|text_align:left|color:%23500000″ use_theme_fonts=”yes” css_animation=”none”][vc_row_inner][vc_column_inner width=”1/2″][vc_column_text]
Microsoft Hololens goggles are available for use given software compatibility. They are maining used for research development projects to address scientific visualization objectives.
[/vc_column_text][vc_btn title=”REQUEST RESOURCE FORM” style=”outline-custom” outline_custom_color=”#500000″ outline_custom_hover_background=”#500000″ outline_custom_hover_text=”#ffffff” shape=”square” align=”center” link=”url:https%3A%2F%2Fgeosat.tamu.edu%2Fwp-content%2Fuploads%2F2018%2F11%2FGEOSAT-Resource-Request-Form.pdf|title:Request%20form||” css=”.vc_custom_1542754346359{padding-left: 20px !important;background-color: #f0f0f0 !important;}”][vc_raw_html]JTNDYSUyMG5hbWUlM0QlMjJzZWN0aW9uLWhhcHRpY3MlMjIlM0UlM0MlMkZhJTNF[/vc_raw_html][/vc_column_inner][vc_column_inner width=”1/2″][vc_gallery type=”nivo” interval=”3″ images=”1483,1872,1873,1874,1875,1876,1877,1878,1879,1880,1881,1882″ img_size=”full” onclick=”” css_animation=”fadeIn”][/vc_column_inner][/vc_row_inner][/vc_column][/vc_row][vc_row full_width=”stretch_row” css=”.vc_custom_1541102802024{padding-top: 15px !important;padding-bottom: 50px !important;background-color: #ffffff !important;}”][vc_column][vc_custom_heading text=”HAPTICS” font_container=”tag:h1|text_align:left|color:%23500000″ use_theme_fonts=”yes” css_animation=”none”][vc_row_inner][vc_column_inner width=”1/2″][vc_column_text]
Three haptic devices are available for use in collaboration with Dr. Medin a-Cetina’s Stochastic Geomechanics Laboratory SGL. These are being used to “touch” data representing static to dynamic processes changing in space and time. The feedback provided by the haptics allow to design and test hypersurfaces of data, from physical representations (e.g. any surface topography and textures) to solutions of multi-dimensional partial differential equations representing displacem ents and forces in space and time.
[/vc_column_text][vc_btn title=”SGL WEBSITE” style=”outline-custom” outline_custom_color=”#500000″ outline_custom_hover_background=”#500000″ outline_custom_hover_text=”#ffffff” shape=”square” link=”url:http%3A%2F%2Fzenon-sgl.tamu.edu|title:Request%20form||” css=”.vc_custom_1538427348893{background-color: #ffffff !important;}”][vc_btn title=”REQUEST RESOURCE FORM” style=”outline-custom” outline_custom_color=”#500000″ outline_custom_hover_background=”#500000″ outline_custom_hover_text=”#ffffff” shape=”square” link=”url:https%3A%2F%2Fgeosat.tamu.edu%2Fwp-content%2Fuploads%2F2018%2F11%2FGEOSAT-Resource-Request-Form.pdf|title:Request%20form||” css=”.vc_custom_1542754366465{background-color: #ffffff !important;}”][/vc_column_inner][vc_column_inner width=”1/2″][vc_gallery type=”nivo” interval=”3″ images=”1886,1887,1888,1889,1890,1891,1892,1893,1894,1895,1896,1897,1904″ img_size=”full” onclick=”” css_animation=”fadeIn”][/vc_column_inner][/vc_row_inner][vc_raw_html]JTNDYSUyMG5hbWUlM0QlMjJzZWN0aW9uLWdlb3NwYXRpYWwtZGF0YSUyMiUzRSUzQyUyRmElM0U=[/vc_raw_html][/vc_column][/vc_row][vc_row full_width=”stretch_row” css=”.vc_custom_1510095479463{padding-top: 15px !important;padding-bottom: 50px !important;background-color: #f0f0f0 !important;}”][vc_column][vc_custom_heading text=”GEOSPATIAL DATA” font_container=”tag:h1|text_align:left|color:%23500000″ use_theme_fonts=”yes”][vc_row_inner][vc_column_inner width=”1/2″][vc_column_text el_class=”marginbottom-60″]
The map collection includes over 250,000 print maps and aerial photographs. The collection strengths are materials representing Texas, United States, and Central and South America. A large collection of topographic material from all regions of the world is available. The collection includes historic and modern Brazos County aerial imagery, worldwide travel and recreation maps, political maps, outline and base maps, physical sciences maps, special category maps, and historical maps. Foreign thematic maps include a large selection of WWII era Army Mapping Service maps. Most maps are early 20th century to the present.
[/vc_column_text][vc_btn title=”MAPS & GIS COLLECTIONS ” style=”outline-custom” outline_custom_color=”#500000″ outline_custom_hover_background=”#500000″ outline_custom_hover_text=”#ffffff” shape=”square” link=”url:http%3A%2F%2Flibrary.tamu.edu%2Fservices%2Fmap_gis%2Fcollections.html|title:Request%20form||” css=”.vc_custom_1538519626338{background-color: #ffffff !important;}”][vc_btn title=”GIS DATA REQUEST FORM” style=”outline-custom” outline_custom_color=”#500000″ outline_custom_hover_background=”#500000″ outline_custom_hover_text=”#ffffff” shape=”square” link=”url:https%3A%2F%2Fphp.library.tamu.edu%2Farcgis%2Fdatarequest.php|title:Request%20form||” css=”.vc_custom_1538519644194{background-color: #ffffff !important;}”][vc_raw_html]JTNDYSUyMG5hbWUlM0QlMjJzZWN0aW9uLWRyb25lcy1hbmQtYXV0b25vbW91cyUyMiUzRSUzQyUyRmElM0U=[/vc_raw_html][/vc_column_inner][vc_column_inner width=”1/2″][vc_gallery type=”nivo” interval=”3″ images=”2414,2426,2427″ img_size=”full”][/vc_column_inner][/vc_row_inner][/vc_column][/vc_row][vc_row full_width=”stretch_row” css=”.vc_custom_1541106115105{padding-top: 15px !important;padding-bottom: 50px !important;}”][vc_column][vc_custom_heading text=”DRONES AND AUTONOMOUS VEHICLES ” font_container=”tag:h1|text_align:left|color:%23500000″ use_theme_fonts=”yes”][vc_row_inner css=”.vc_custom_1510097490456{padding-bottom: 13px !important;}”][vc_column_inner width=”1/2″][vc_column_text]
TAMU GEOSAT Affiliates are actively engaged in developing and modifying autonomous vehicles for a variety of remote sensing applications. Payload-directed flight research is also ongoing. Platforms include fixed-wing and roto-coptor vehicles.
[/vc_column_text][vc_btn title=”REQUEST RESOURCE FORM” style=”outline-custom” outline_custom_color=”#500000″ outline_custom_hover_background=”#500000″ outline_custom_hover_text=”#ffffff” shape=”square” align=”center” link=”url:https%3A%2F%2Fgeosat.tamu.edu%2Fwp-content%2Fuploads%2F2018%2F11%2FGEOSAT-Resource-Request-Form.pdf|title:Request%20form||” css=”.vc_custom_1542754387530{background-color: #ffffff !important;}”][vc_raw_html]JTNDYSUyMG5hbWUlM0QlMjJzZWN0aW9uLXF1YWRjb3B0ZXJzLW9jdG9wdGVycyUyMiUzRSUzQyUyRmElM0U=[/vc_raw_html][/vc_column_inner][vc_column_inner width=”1/2″][vc_gallery type=”nivo” interval=”3″ images=”2428,2429,2430″ img_size=”full” onclick=”” css_animation=”fadeIn”][/vc_column_inner][/vc_row_inner][/vc_column][/vc_row][vc_row full_width=”stretch_row” css=”.vc_custom_1541105968066{padding-top: 15px !important;padding-bottom: 50px !important;background-color: #f0f0f0 !important;}”][vc_column][vc_custom_heading text=”QUADCOPTERS & OCTOPTERS ” font_container=”tag:h1|text_align:left|color:%23500000″ use_theme_fonts=”yes”][vc_row_inner][vc_column_inner width=”1/2″][vc_column_text]
The LASERS Lab conducts research in remote sensing of the environment, with a core component in laser or lidar remote sensing of three-dimensional vegetation structure using data from sensors on terrestrial, airborne and spaceborne platforms. The lab owns and operates advanced laser scanning and imaging systems on terrestrial and UAV/UAS platforms and uses state of the art remote sensing methods for assessing ecosystem dynamics and land cover mapping.
[/vc_column_text][vc_btn title=”LASERS LAB WEBSITE” style=”outline-custom” outline_custom_color=”#500000″ outline_custom_hover_background=”#500000″ outline_custom_hover_text=”#ffffff” shape=”square” link=”url:https%3A%2F%2Faglifesciences.tamu.edu%2Flasers%2F|title:Request%20form||” css=”.vc_custom_1538427592084{background-color: #ffffff !important;}”][vc_btn title=”REQUEST RESOURCE FORM” style=”outline-custom” outline_custom_color=”#500000″ outline_custom_hover_background=”#500000″ outline_custom_hover_text=”#ffffff” shape=”square” link=”url:https%3A%2F%2Fgeosat.tamu.edu%2Fwp-content%2Fuploads%2F2018%2F11%2FGEOSAT-Resource-Request-Form.pdf|title:Request%20form||” css=”.vc_custom_1542754404369{background-color: #ffffff !important;}”][vc_raw_html]JTNDYSUyMG5hbWUlM0QlMjJzZWN0aW9uLWdyb3VuZC1wZW5ldHJhdGluZyUyMiUzRSUzQyUyRmElM0U=[/vc_raw_html][/vc_column_inner][vc_column_inner width=”1/2″][vc_gallery type=”nivo” interval=”3″ images=”2433,2431,2432,2444″ img_size=”full” onclick=”” css_animation=”fadeIn”][/vc_column_inner][/vc_row_inner][/vc_column][/vc_row][vc_row full_width=”stretch_row”][vc_column][vc_custom_heading text=”GROUND PENETRATING RADAR ” font_container=”tag:h1|text_align:left|color:%23500000″ use_theme_fonts=”yes”][vc_row_inner][vc_column_inner width=”1/2″][vc_column_text]
Ground Penetrating Radar (GPR) works on detecting objects that are denser than the soil environment they are in. With ground radar, depth is dependent on radar frequency and soil type. Higher frequency ground-penetrating radar antennas have higher resolution for smaller objects, yet lose signal depth. Lower frequency radars have greater depths yet are better at detecting larger objects. GEOSAT affiliates are currently involved in GPR-agriculture applications.
[/vc_column_text][vc_btn title=”REQUEST RESOURCE FORM” style=”outline-custom” outline_custom_color=”#500000″ outline_custom_hover_background=”#500000″ outline_custom_hover_text=”#ffffff” shape=”square” align=”center” link=”url:https%3A%2F%2Fgeosat.tamu.edu%2Fwp-content%2Fuploads%2F2018%2F11%2FGEOSAT-Resource-Request-Form.pdf|title:Request%20form||” css=”.vc_custom_1542754421745{background-color: #ffffff !important;}”][vc_raw_html]JTNDYSUyMG5hbWUlM0QlMjJzZWN0aW9uLXNwZWN0cm9yYWRpb21ldGVyLWh5cGVyc3BlY3RyYWwlMjIlM0UlM0MlMkZhJTNF[/vc_raw_html][/vc_column_inner][vc_column_inner width=”1/2″][vc_column_text][/vc_column_text][/vc_column_inner][/vc_row_inner][/vc_column][/vc_row][vc_row full_width=”stretch_row” css=”.vc_custom_1541105986283{padding-top: 15px !important;padding-bottom: 50px !important;background-color: #f0f0f0 !important;}”][vc_column][vc_custom_heading text=”SPECTRORADIOMETER &
HYPERSPECTRAL CAMERAS” font_container=”tag:h1|text_align:left|color:%23500000″ use_theme_fonts=”yes”][vc_row_inner][vc_column_inner width=”1/2″][vc_column_text]
GEOSAT maintains and operates field-based radiometers and an imaging hypersepectral camera that is mounted on a UAV. Hyperspectral remote sensing permits surface biophysical property characterization and mapping.
[/vc_column_text][vc_btn title=”REQUEST RESOURCE FORM” style=”outline-custom” outline_custom_color=”#500000″ outline_custom_hover_background=”#500000″ outline_custom_hover_text=”#ffffff” shape=”square” align=”center” link=”url:https%3A%2F%2Fgeosat.tamu.edu%2Fwp-content%2Fuploads%2F2018%2F11%2FGEOSAT-Resource-Request-Form.pdf|title:Request%20form||” css=”.vc_custom_1542754439279{background-color: #f0f0f0 !important;}”][vc_raw_html]JTNDYSUyMG5hbWUlM0QlMjJzZWN0aW9uLXRyaW1ibGUtdW5pdHMlMjIlM0UlM0MlMkZhJTNF[/vc_raw_html][/vc_column_inner][vc_column_inner width=”1/2″][vc_column_text][/vc_column_text][/vc_column_inner][/vc_row_inner][/vc_column][/vc_row][vc_row full_width=”stretch_row”][vc_column][vc_custom_heading text=”TRIMBLE R-10 UNITS ” font_container=”tag:h1|text_align:left|color:%23500000″ use_theme_fonts=”yes”][vc_row_inner][vc_column_inner width=”1/2″][vc_column_text]GPR receivers permit localization and enable efficient fieldwork activities.[/vc_column_text][vc_btn title=”REQUEST RESOURCE FORM” style=”outline-custom” outline_custom_color=”#500000″ outline_custom_hover_background=”#500000″ outline_custom_hover_text=”#ffffff” shape=”square” align=”center” link=”url:https%3A%2F%2Fgeosat.tamu.edu%2Fwp-content%2Fuploads%2F2018%2F11%2FGEOSAT-Resource-Request-Form.pdf|title:Request%20form||” css=”.vc_custom_1542754455401{background-color: #ffffff !important;}”][/vc_column_inner][vc_column_inner width=”1/2″][vc_gallery type=”nivo” interval=”3″ images=”2415,2424,2425″ img_size=”full” onclick=”” css_animation=”none”][/vc_column_inner][/vc_row_inner][/vc_column][/vc_row]